Monitoring CBRS for Communication Service Providers
Learn how NETSCOUT solutions enable proactive network monitoring for 5G CBRS networks.


Using Smart Data from the NETSCOUT instrumentation layer, nGeniusONE, nGenius Session Analyzer, and nGenius Business Analytics provides visibility into the subscriber experience and allows for end-through-end troubleshooting with actionable intelligence.
NETSCOUT’s analytics solutions provide easy-to-follow workflows and drilldowns. Carriers can execute subscriber-based troubleshooting from a single pane of glass–using only one system, improve first call to resolution (FCS), and optimize the subscriber experience. This blog demonstrates how these solutions enable proactive network monitoring for 5G CBRS networks.
What Is CBRS?
Although the Citizens Broadband Radio Service (CBRS) can be used for 4G LTE, it is ideally suited to delivering fixed or mobile 5G new radio (5G NR). Many cable, mobile, and multiple system operators have deployed or are deploying a 5G CBRS network.
How to Monitor 5G CBRS
NETSCOUT offers four products communications service providers (CSPs) can use for monitoring CBRS: nGeniusONE (nG1), nGenius Business Analytics (nBA), nGenius Session Analyzer (nBA), and TrueCall, for RAN data.
nGeniusONE for Monitoring Metrics: Use Our Expertise or Get Truly Customized
With nG1, you can proactively monitor your network and get alerted to applications or network functionality degradation or failure. You can use our out-of-the-box key performance indicators (KPIs), or we can work with you to create user-specific metrics and customize these dashboards for your network, including specific interfaces that are active in your network or based on device views for all the different devices active in your network.
Your network technology is very complex. By breaking down these complex technologies into individual functional units and then monitoring each smaller component or process, you can receive proactive alerts from the system and isolate the degradation or failure much faster.
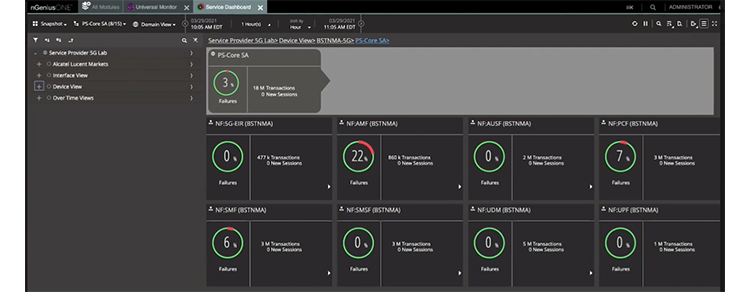
Figure 1: nGenius Dashboard
The nG1 application dashboard shows any trouble in your network with a simple snapshot view of the different applications and interfaces that are active in your network. If there is a spike in failures, the related circles will turn red (see Figure 1). In this example, AMF in the Boston area shows a 22 percent failure rate, PCF is a 7 percent failure rate, and SMF is a 6 percent failure rate. If your network experiences degradation, you’ll receive an alert depending on how you configured the threshold and you can initiate your service triage workflows.
You can also click any of the KPIs to drill down into the service monitors (see Figure 2).
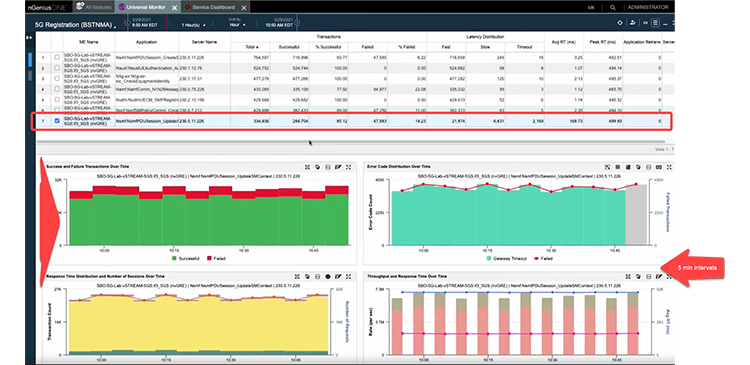
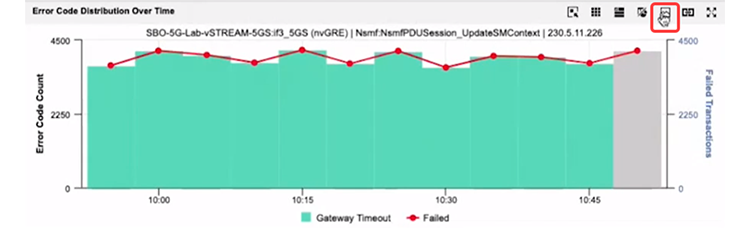
The summary view shows your network applications and servers as well as key metrics. The example in Figure 2 lists total transactions along with success and failure counts and percentages, latency distribution, and other response-time metrics, and you can quickly see which of the applications have the most failures. In this example, one application shows a 14.23 percent failure rate. The graphs at the bottom of the screen show various KPIs at five-minute intervals, including gateway timeouts (see Figure 3).
You can analyze specific failures in the network by using the using the session analysis view (see Figure 4).
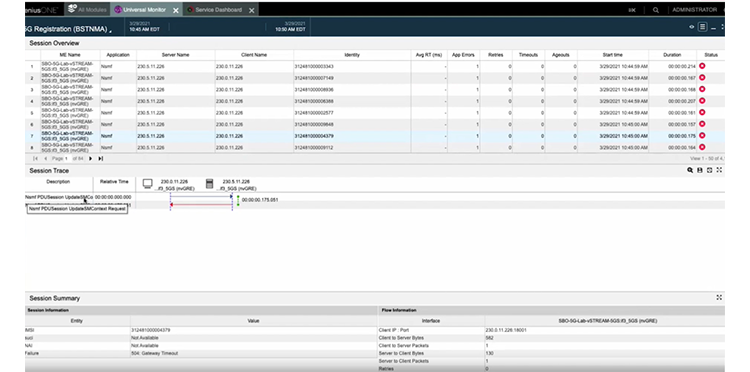
In this example, you see all the sessions that timed out with a 504 gateway error as well as the exact subscribers (IMSIs) that had that error and the specific API calls (UpdateSMSContext) that received the error.
From this view, you can launch nSA to look at the session trace from the edge of your RAN to the core.
nGenius Session Analyzer Subscriber Troubleshooting and Call Flow Analysis
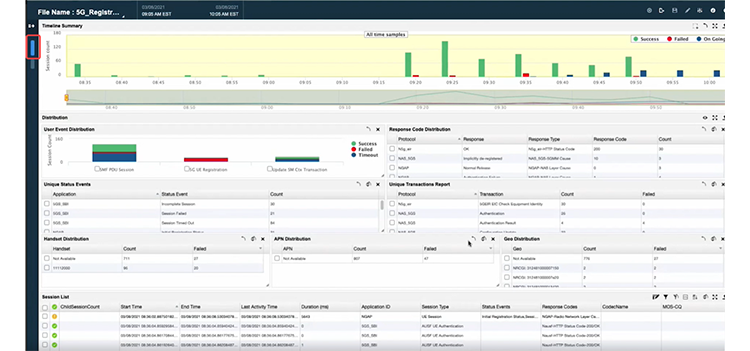
The nSA summary view shows when the chosen subscriber was active in the network along with that user’s successful and failed transactions, applications accessed, locations, and protocol interfaces (see Figure 5).
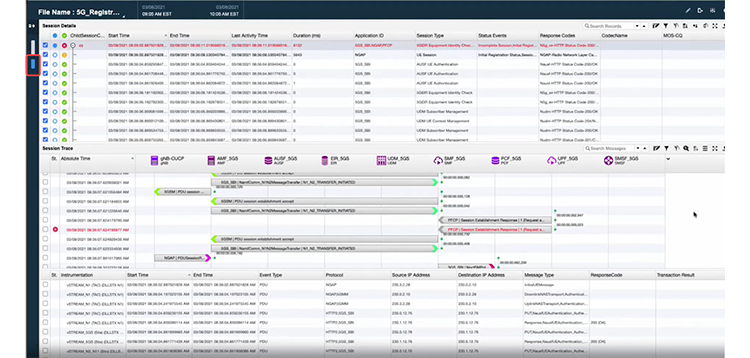
You can also see end-to-end session tracing for any subscriber (see Figure 6).
nGenius Business Analytics: Data Collection and Enrichment
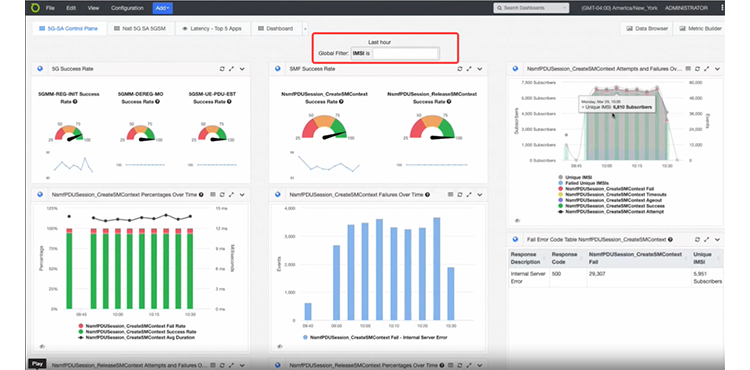
The nBA platform is a big data analytics platform that allows you to look at all subscribers and devices in your network and see what users were doing when they were doing it, and what their experience was on the applications they accessed. nBA is an open platform to which you can bring in your specific network data to enrich the core NETSCOUT Smart Data and create your own multidimensional views based on NETSCOUT KPIs.
In this example (see Figure 7), you can see 6,810 unique subscribers were active in the last hour in this part of the network, and you can see the average user experience with key network functionalities.
Learn More About NETSCOUT Analytics Solutions
The NETSCOUT analytics solution is based on smart visibility at your instrumentation layer—from the RAN edge to the access layer to the core. It can see and show you your entire network, including virtualized environments running on virtual machines (VMs) or containers or your hybrid environments in your data centers. We can deploy this technology edge to edge to provide Smart Data to the core applications.
nGeniusONE is our proactive service monitoring and assurance application.
nGenius Business Analytics is our scalable big data analytics platform.
nGenius Session Analyzer is our subscriber troubleshooting and session-tracing application.
TrueCall is our RAN analysis and GeoAnalytics and optimization application.
Learn more about NETSCOUT’s cable and MSO provider network solutions.