Top Service Provider Insights and Trends: Fraud Detection and Prevention Survey
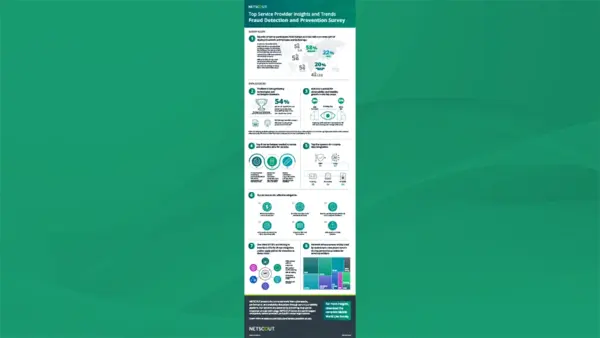
Communications service providers (CSPs) can see how peers are detecting and mitigating signaling fraud, user plane fraud, and malicious traffic in 4G and 5G standalone (SA) networks. The infographic summarizes results of a Mobile World Live fraud detection and prevention survey, including data sources, metrics, and integration priorities.
Who took part in the survey?
Most participants came from Europe and Asia, with a near-even split between deployed network architectures and technologies. The infographic reports regional shares of 58 percent Europe, 22 percent Asia, and 20 percent rest of the world.
Which data sources do CSPs use for security?
Traditional data gathering techniques dominate. According to the infographic, 54 percent of respondents use packet core probe data from 3GPP packets in the control and user planes, while 5G core service-based architecture (SBA) logs and radio access network (RAN) traceport data are each used by 41 percent and are gaining popularity.
What metrics and integrations matter for mitigation?
The infographic lists the top six metrics for effective mitigation and the top five systems for security data integration. The metrics include:
• Return on investment from cost avoidance and fraud reduction
• Performance overhead and scale
• Detection coverage across prioritized use cases
• Integration effort and time-to-value
• False-positive rate and alert precision
What does the survey say about threat mitigation APIs?
One third of CSPs plan to introduce application programming interfaces (APIs) for threat mitigation or to apply detection policies in areas such as DNS resolver policies, policy control functions, IMS throttling, 5G SA slice containment, and SMS firewall actions.
Frequently Asked Questions
Where is visibility growth expected?
The infographic points to RAN traceport and 5G SA service-based interface data as the areas with the highest growth potential from partial to full coverage, at 24 percent and 21 percent.
Where can readers find more detail?
The infographic directs readers to the complete Mobile World Live survey.
Asset Type: Infographic