
Just as the way we work has evolved, so too must our data centers transform to support hybrid workers. Companies, employees, and IT organizations continuously respond to the dynamic demands of digital transformation, accelerating in both public cloud and SaaS adoption and migrations to keep pace.
nGenius Enterprise Performance Management provides end-through-end visibility that can ease these transitions and ensure quality user experience is maintained throughout the life of the project.
Monitoring
Monitoring before, during and after application and workload transitions to cloud and co-los to ensure availability and agility of migrations
Analysis
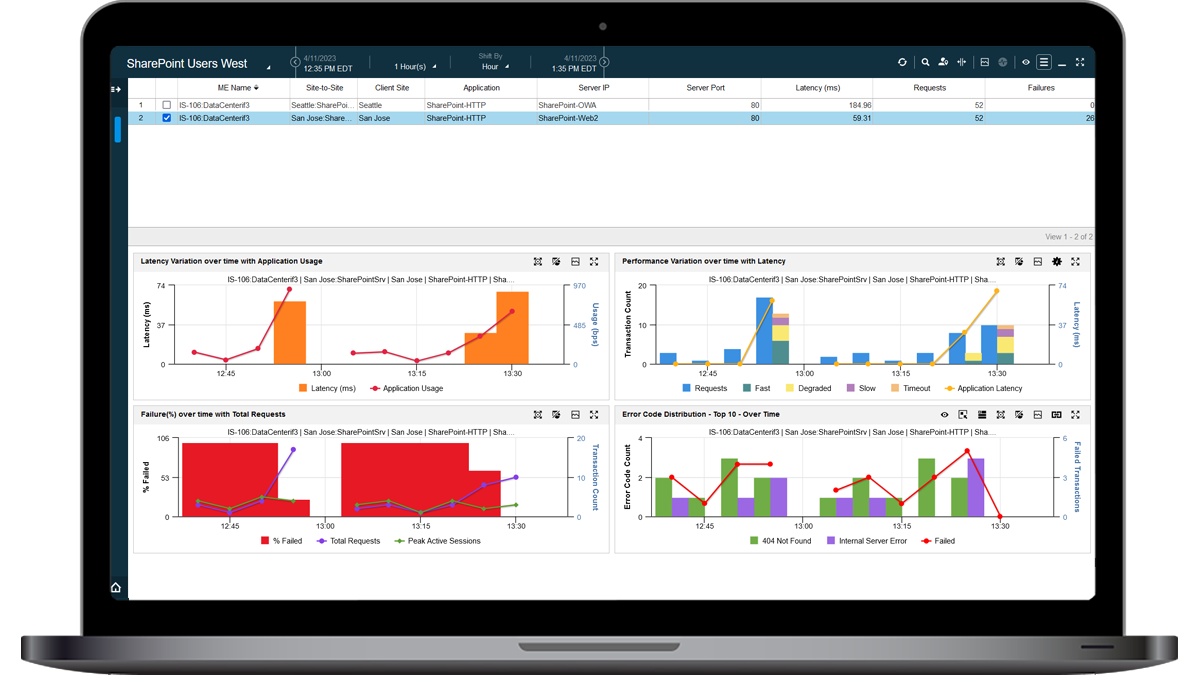
Performance analysis of new SaaS applications to assure quality end-user experience
Troubleshooting
Mitigate troubleshooting complexity across multi-cloud environments to reduce MTTR

Digital Transformation and Business Continuity
As you strive to meet customer and employee expectations, as well as revenue and business goals, IT has been critical to your organization’s transformation. Successful migrations to public cloud, Co-Los, and SaaS applications depend on continuous and reliable visibility.
NETSCOUT performance management solutions help companies quickly adapt and solve business continuity challenges as they navigate through the digital age.
The NETSCOUT Solution
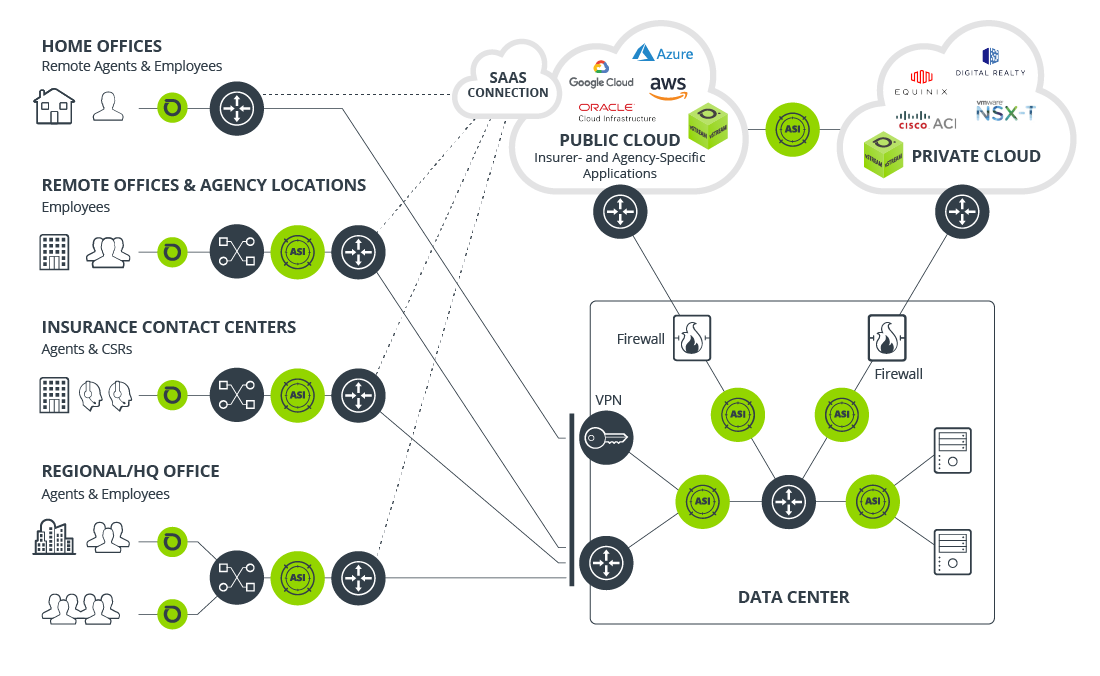
NETSCOUT network and application performance management solutions provide end-through-end visibility throughout the hybrid cloud environment
Cloud & Co-Lo Performance
With cloud central to companies’ DCX strategies, ensuring smooth transitions and quality performance is essential. NETSCOUT powers comprehensive visibility and analysis solutions for digital transformation to provide end-through-end analysis anywhere for any service.
SaaS & UCaaS Performance
The adoption and use of SaaS and UCaaS applications like Office 365 and Webex have increased exponentially in this last year. Ensure your customers and employees have the same user experience from wherever they access these services.
SDN Performance
Software-Defined Networks (SDNs) and virtualization have become the gold-standard in many data center environments. Learn how NETSCOUT can ensure visibility remains complete, regardless of the technology implemented.
NETSCOUT nGenius Enterprise Performance Management
nGenius Enterprise Performance Management combines our market-leading packet-based monitoring solution, nGeniusONE, with our award-winning synthetic testing capabilities to assure network and application performance and provide critical insights into user experience.
nGeniusONE
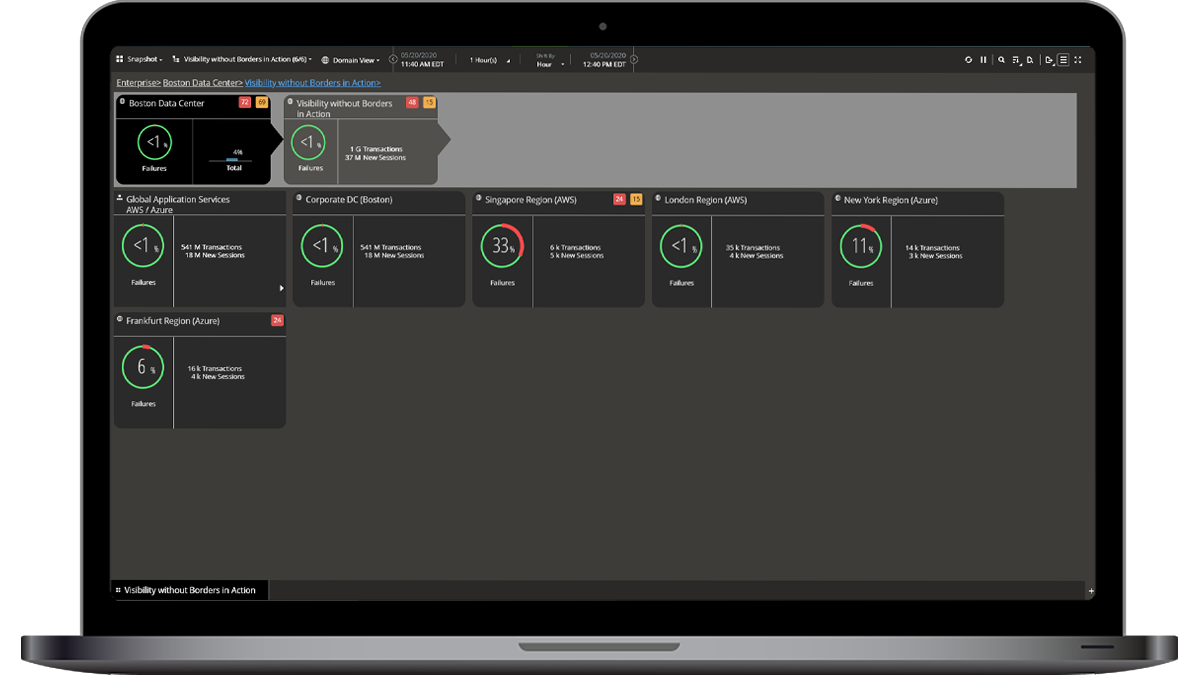
NETSCOUT delivers passive monitoring with visibility into actual packets traversing the enterprise. This wire-data on north-south physical Ethernet segments, as well as across virtualized environments over east-west traffic paths provides consistent, real-time insights. This is essential to gain precise metrics on actual activity of users as they interact with application services in their data centers, Co-lo’s, public cloud, and SaaS providers.
nGeniusPULSE
NETSCOUT solutions simulate user actions with applications across the enterprise by performing synthetic or active monitoring. Scheduled, consistent tests, even when clients aren’t active, deliver detailed performance and availability analytics to troubleshoot issues across the Internet / WAN to data centers, cloud, or SaaS applications to ensure remote user connectivity and quality user experiences.
Technology Partners
NETSCOUT has established strategic alliances to collaborate with best-in-class technology partners, providing integrated solutions for our mutual customers and the success of their data center transformations.


